Faster Reporting with Custom Charts
AuditComply release 5.7 has now been released and with that comes better reporting customizations for our users. Our new Custom Charts feature, allows you to pull all your data together to compare and contrast, helping you find clarity when you need it most. We can build charts that reflect asset, template or compliance program performance over time.
If you have any questions about the recent release please contact us or visit our Help Centre.
Analyze, Combine & Model
Build Your Own Charts
Use our easy-to-use chart builder to connect all your data in one place. Helping you build custom views, visualize trends, make informed decisions, collaborate and report as you go.
Analyze Trends
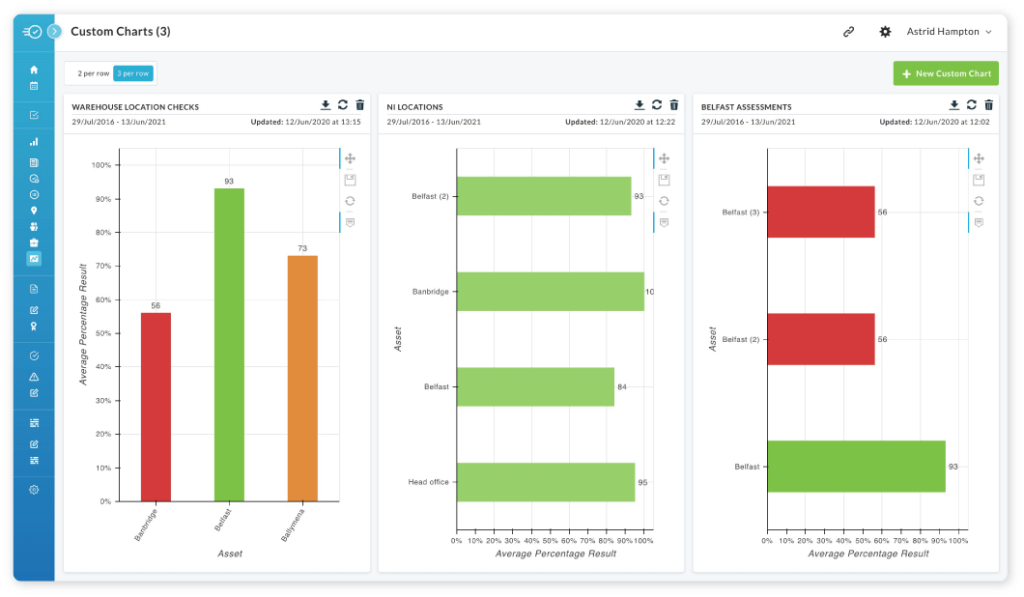
Compare performance across your organization over time. With a fully customizable axis, you can choose a reporting format to satisfy your organization’s needs.
Compare & Collaborate
Evaluate & compare different datasets, whether you’re analysing asset or audit programs over time. Simultaneously, use our advanced reporting capabilities to share notes on key takeaways.
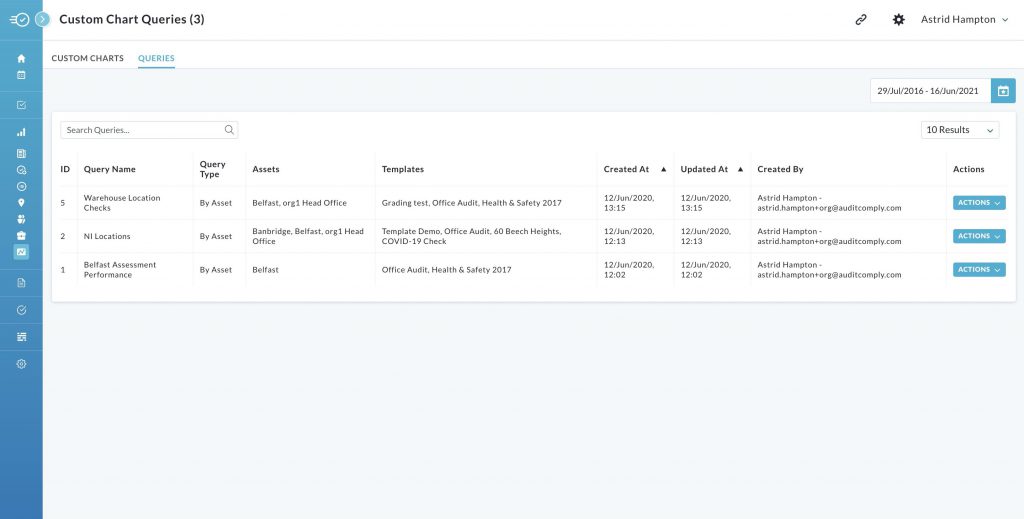
Query Builder
Pull custom metrics without data manipulation by creating templates for your charts. Just simply save your queries so you can reuse and share with your team, perfect for KPI monitoring.
How to get started

There’s no learning curve. Unlike other platforms, AuditComply’s custom chart builder isn’t complicated or time-consuming. When you’re ready to turn your raw data into something that’s both visual and easy to understand, just follow these steps:
1. Open your Navigation Bar
2. Click Custom Charts
3. Select New Customer Chart
4. Choose whether you want to report by Asset or Over Time.
5. Start gathering the information you need!
How can I use this feature?
Example Use Case:
Analyzing Food Safety Program Performance Across Sites

You may be using AuditComply to report on or maintain compliance with a particular standard within your organization such as HACCP, AuditComply’s new feature will make this process quicker and easier. For many, meeting the requirements of this food safety standard is imperative but what if you have multiple facilities (assets), spread across the country? Each with their own assessments and Work Programs in place. Is there a quick way to review the performance of each program across each of your sites?
With Custom Charts you can do just that. When building a series of charts you can pull the assessment & asset data together to compare and analyze our HACCP program performance instantly.
About AuditComply
AuditComply is an Enterprise Risk Management platform. An integrated risk management solution revolutionizing the way enterprises manage, analyze & report on critical risk.
AuditComply operates in highly regulated industries such as Automotive, Aviation, Food & Beverage, Oil & Gas, Finance, and Manufacturing with key fortune 500 clients situated throughout the UK, EU, US, Middle East and Asia Pacific regions.